Knowledge Cartography for mapping wicked problems: questions, ideas, arguments and sources
There is a long lineage of software development efforts focused on how we can better support reflective deliberation around complex dilemmas. Such tools differ in two key respects from conventional documents, threaded discussion forums or flat comment listings:
- Introduce a language that slows thinking down to consider what is the nature of my contribution? Instead of simply writing down ideas as lists or prose, these tools ask you to consider if you are raising a new, important question, a position or idea, or an argument of some sort.
- Make the structure of the dialogue visible as a tree/network — you can literally ‘see what you’re saying’. A notation called IBIS (Issue-Based Information System) has emerged as a ‘lingua franca’ that seems to provide a helpful structure. This can be done with pen and paper, but visual hypertext tools add infinite space and powerful ways to connect contributions.
The screen below shows how IBIS is rendered in Compendium, a visual hypertext application developed by a team (Anna De Liddo, Michelle Bachler, Ale Okada) led by CIC’s Simon Buckingham Shum over a decade’s R&D, collaborating with, and building on the groundbreaking work of Jeff Conklin, Al Selvin and Maarten Sierhuis. The history of this approach is documented in the books on this page, and this website (now archived) of the Compendium Institute. Compendium is available as a free, open source desktop Java app that runs on Mac/Win/Linux.
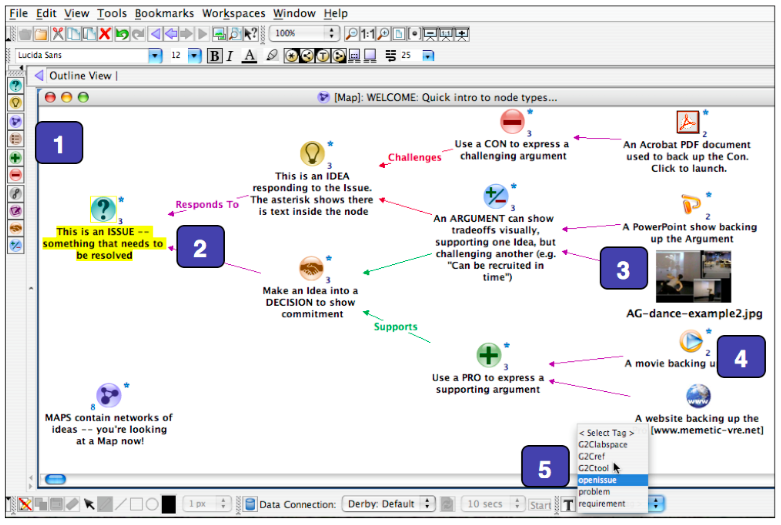
Compendium’s visual language for IBIS. Key to the numbered elements in the image: [1] Drag and drop nodes from the palette on the left of the screen onto the map. [2] Question-, light-bulb-, and handshake icons with (named) links in order to capture and link key issues, ideas, arguments and decisions. [3] Relevant media resources/websites can be linked into this discussion. (Users can also create their own palettes of icons.) [4] A digit superimposed on a node means that it appears in more than one map, i.e. the same idea or document can play roles in multiple contexts and conversations, yet be linked. [5] User-defined keyword tags can be annotated onto nodes to help when searching for related material across multiple maps
Learn more. . .
Events
Two members of CIC’s team have been involved with visual sensemaking tools such as this: Simon Buckingham Shum and Kailash Awati. Events to introduce IBIS mapping and Compendium to UTS colleagues and partners have been run in collaboration with Paul Culmsee, one of the world’s leading practitioners of Issue/Dialogue Mapping. See July 2015 Workshop and May 2017 Workshop.
Example Maps
Dialogue/Issue Mapping videos from Jeff Conklin and Paul Culmsee: practitioners with years of experience working with clients on truly wicked problems
Compendium Institute tutorial and exercises: detailed walkthrough of Compendium’s functionality
In normal Dialogue/Issue mapping, arguments are captured relatively informally as Pros/Cons, linked to Ideas via supports/challenges links. However, there are many kinds of arguments commonly used in everyday, which come with a lot of implicit assumptions that can be worth teasing out. There is a way to unpack these using Argumentation Schemes, which we have rendered visually as Compendium templates. See this example:
Publications
Interactive visual tools for mapping wicked problems are the focus of a longitudinal research program, reflected in the books, papers, projects and impact outlined below.
Books
Selvin, A. and Buckingham Shum, S. (2015). Constructing Knowledge Art: An Experiential Perspective on Crafting Participatory Representations. Human-Centred Informatics Series (Ed. John M. Carroll). Morgan & Claypool.
Okada, A., Buckingham Shum, S. and Sherborne, T. (Eds.) (2008; 2014). Knowledge Cartography: Software Tools and Mapping Techniques. London, UK: Springer. (Second Edition)
Kirschner, P.A., Buckingham Shum, S.J. and Carr, C.S. (Eds.) (2003). Visualizing Argumentation: Software Tools for Collaborative and Educational Sense-Making. London, UK: Springer.
Papers
Selvin, A.M., Buckingham Shum, S. and Aakhus, M. (2012). The Practice Level in Participatory Design Rationale: Studying Practitioner Moves and Choices. In: John M. Carroll (Ed.), Creativity and Rationale: Enhancing Human Experience by Design. Springer: London. ISBN 978-1-4471-4111-2. Reprinted from Human Technology, 2010, 6, (1), pp. 71- 105.
Bailey, H., Bachler, M., Buckingham Shum, S., Le Blanc, A., Popat, S., Rowley, A. and Turner, M. (2009). Dancing on the Grid: Using e-Science Tools to Extend Choreographic Research. Philosophical Transactions of the Royal Society A, 13 July 2009, Vol. 367, No. 1898, pp. 2793-2806.
Sierhuis, M. and Buckingham Shum, S. (2008). Human-Agent Knowledge Cartography for e-Science: NASA Field Trials at the Mars Desert Research Station. In: Okada, et al. (Eds.), Knowledge Cartography: Software Tools and Mapping Techniques. Springer: London.
Buckingham Shum, S., Selvin, A., Sierhuis, M., Conklin, J., Haley, C. and Nuseibeh, B., (2006). Hypermedia Support for Argumentation-Based Rationale: 15 Years on from gIBIS and QOC. In: Dutoit, A.; McCall, R.; Mistrik, I. and Paech, B. (Eds.) Rationale Management in Software Engineering, pp.111-132. Springer-Verlag: Berlin.
Buckingham Shum, S., MacLean, A., Bellotti, V., & Hammond, N. (1997). Graphical Argumentation and Design Cognition. Human-Computer Interaction, 12, (3), pp. 267-300
Non-academic impact summary
UK Research Excellence Framework 2014: Impact Case Study (Compendium)
Example projects making the structure of deliberations visible and malleable:
UK Joint Research Councils e-Dance Project
European Union Catalyst Project